|
|
Italicized links open a new window to an external site
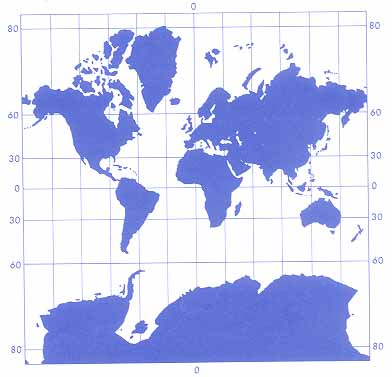
Which is largest, Greenland, South America or Africa?
This question is most effective if you pose it while standing before an easily seen Mercator projection world map. Looking at such a map most students will answer with certainty, "Greenland". Most will say Greenland anyway, as the world map with which we are most familiar is the Mercator projection. Have them examine a Peters projection or globe, and their answers will change. Side by side, the differences are stark. Clearly, Africa is largest, followed by South America. Greenland appears a very distant third. (An excellent explanation for the relative value of the Peters projection was given by Aaron Sorkin when he wrote the script for this scene from The West Wing. http://www.youtube.com/watch?v=n8zBC2dvERM )
 |
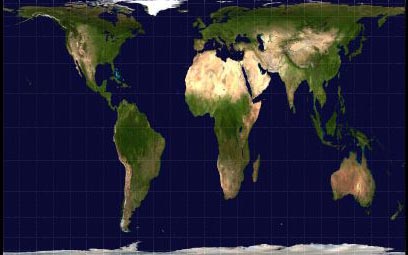 |
| Mercator projection | Gall-Peters Projection |
| click on each image to open a standalone browser window containing additional information for it. | |
Looking up the numbers in a reference work tells the same tale. However, it is clear that the reference you use makes a difference. The table below contains my research. Clearly some of the discrepancies, but not all, result from rounding. The date a measurement was made or the type of equipment used to make it, most probably account for the others. We know that coast lines change over time (land is constantly being lost in some places and added in others), and that satellite measurements are more accurate than those done earlier. This appears to be yet another example of the need to focus on understanding processes rather than memorizing answers in an enlightened classroom.
If you want, follow-up your discussion of this question by breaking your class into 3 groups (one to work with Greenland, one with South America and one with Africa). Assign each person in each group one of the references below (and others if you need them). Each is to look up the size of his/her assigned land mass. Have them report their findings to the entire class. As they do so, have each student fill-in the blanks on a table like that below. When it is complete, discuss the discrepancies. Go on to discuss how one could best answer a question like, "How many square miles in Africa?".
If you want to use this table to show your students how to read a data table, make a copy for each class member. Show them how to use the row and column headings to find information at an intersection, and vice versa. Go on to let them practice with questions like, "Which reference title shows the largest number of square miles in Africa?"; and "What number of square miles does the World Almanac give for South America?".
| Reference title | Greenland (sq. mi.) | South America (sq. mi.) | Africa (sq. mi.) |
| Encarta World Atlas 2001 | 840,000 | 6,880,706 | 11,677,239 |
| Britannica 2001 | 840,000 | 6,893,520 | 11,716,640 |
| Merriam-Webster Collegiate Dictionary, Online | 839,999 | 6,880,706 | 11,677,239 |
| Merriam-Webster Collegiate Dictionary, Tenth Edition (1993) | 839,800 | 7,035,357 | 11,596,000 |
| Random House Webster's Unabridged Dictionary, 2nd Ed. | 844,000 | 6,900,000 | 11,700,000 |
| The World Almanac 1998 | 840,000 | 6,900,000 | 11,700,000 |
| Rand-McNally World Atlas, Imperial Edition (1972) | 840,000 | 6,870,000 | 11,685,000 |
| Information Please Online Almanac | 840,000 | 6,879,952 | 11,608,156 |
| Information Please Online Encyclopedia | 836,109 | 6,880,000 | 11,677,240 |
| Information Please Online Dictionary | 844,000 | 6,900,000 | 11,700,000 |
If the above has piqued your interest
Take a look at
- The World in a Room
- Map information at the following sites
return to the Interesting Numbers page
return to the Warm-up activities page
return to the Lesson Ideas page
copyright © 2000-2010
classroomtools.com. All Rights Reserved.
original web posting: Monday, December 18, 2000
last modified:
Sunday, March 07, 2010