|
|
Italicized links open a new window to an external site
Numbers at War
What percentage of its federal budget will the US spend on militarily-related items in 2004? It seems like that should be a simple question to answer. After all, numbers are precise. 2 + 2 always equals 4. Can't we just add up military expenses, then divide by the total budget amount? Is it possible there could be more than one answer?
Judge for yourself.
 |
 |
|
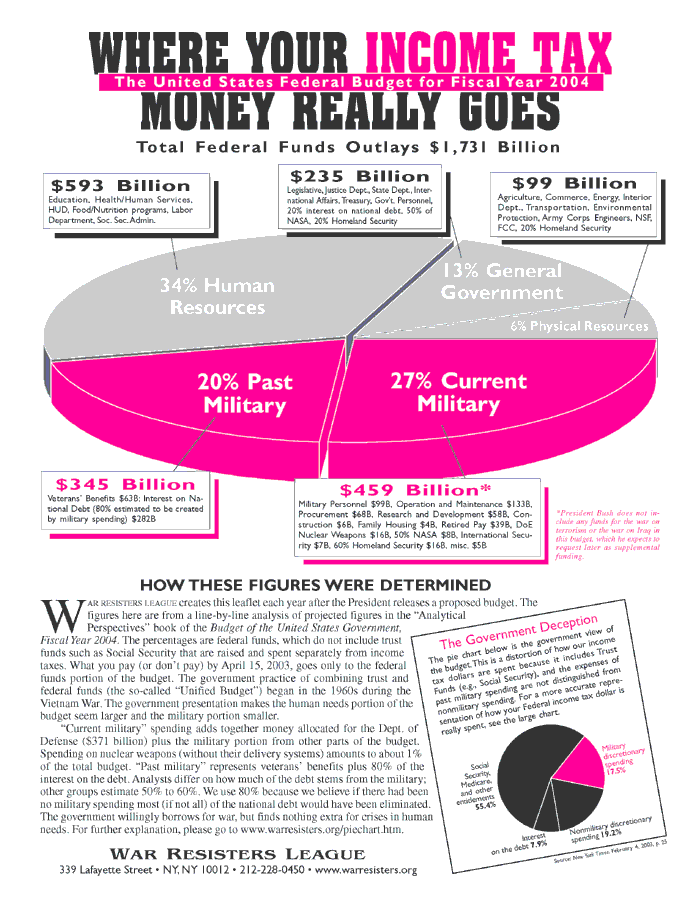
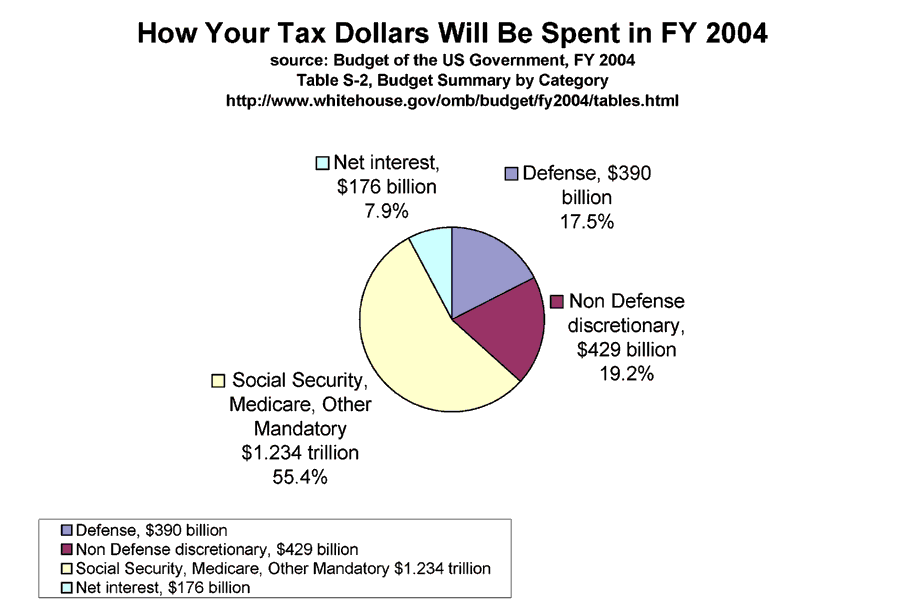
| source: War Resisters League | source: White House Office of Management and Budget |
Put these pages to work
- the Center for Defense Information says that Pentagon spending for FY 2004 will be 51% of the discretionary budget
- the Friends Committee on National Legislation reports it was 42% in 2004 (rising to 43% in 2007 and to 44.4% in 2009).
- how one chooses to categorize the individual items that make up the dividend in the percentage calculation
For example, is a soldier's retirement pay a military expenditure, or is it a direct payment to an individual (like Social Security)?
- what one chooses to include in the total budget number that makes up the divisor in the percentage calculation
Income taxes are used to pay for virtually all non-trust fund federal government expenditures. Therefore, it is logical to exclude the trust funds (Social Security, Medicare, various retirement funds, etc.) from the divisor when asking how our income tax dollars are spent. On the other hand, non-income taxes fund the trust funds. Therefore if one is looking to see how all tax dollars are spent, one should probably include trust fund expenditures.
I should note that prior to FY 1967, trust fund income and expenses were excluded from the types of federal government budget calculations discussed on this page. It is my understanding that the Johnson Administration chose to begin including them as a way to mask the increasing expense of the Vietnam war. As you can see from the pie charts at the top of this page, including trust fund figures makes the military budget appear smaller.
Related Classroomtools.com activities
![]()
return to the Propaganda in the Classroom page
copyright © 2002-2008
classroomtools.com. All Rights Reserved.
original web posting: Tuesday, April 30, 2002
last modified:
Friday, March 28, 2008