|
|
Italicized links open a new window to an external site
How Much Is An Education Worth?
Announcements for previous years' data are available via the following links:
Year-round, Full Time U.S. Male Workers 25 and over, 2016
number of workers: 56,284,000
| Highest Education Attained |
% of workers |
Median Annual Income |
Difference from previous step |
Cumulative difference from 1st step |
No HS diploma |
8.71% | $28,652 | ||
High School graduate |
27.75% | 39,988 | $11,336 | $11,336 |
Some college or Associate degree (AA) |
25.55% | 46,592 | 6,604 | 17,940 |
| Bachelor's degree (BA) and higher | 37.98% | 76,128 | 29,536 | 47,476 |
BA only |
24.01% | 70,096 | 23,504 | 41,444 |
advanced degree |
13.97% | 88,764 | 18,668 | 60,112 |
Year-round, Full Time U.S. Female Workers 25 and over, 2016
number of workers: 44,731,000
| Highest Education Attained |
% of workers |
Median Annual Income |
Difference from previous step |
Cumulative difference from 1st step |
No HS diploma |
4.93% |
$21,996 | ||
High School graduate |
22.03% | 31,148 | $9,152 | $9,152 |
Some college or Associate degree (AA) |
28.89% |
35,776 | 4,628 | 13,780 |
| Bachelor's degree (BA) and higher | 44.15% |
57,252 | 21,476 | 35,256 |
BA only |
26.80% |
51,688 | 15,912 | 29,692 |
advanced degree |
17.35% |
65,364 | 13,676 | 43,368 |
Women's Earnings versus Men's
Year-round, Full Time Workers 25 and over, 2016
| Highest Education Attained | On average, men earned this much more than women in 2016 |
Women's earnings as a % of men's * |
No HS diploma |
$6,656 | 76.77% |
High School graduate |
8,840 | 77.89% |
Some college or Associate degree (AA) |
10,816 | 76.79% |
| Bachelor's degree (BA) and higher | 18,876 | 75.20% |
BA only |
18,408 | 73.74% |
advanced degree |
23,400 | 73.64% |
* If you drop the % sign, the contents of the third column in this table can be thought of as the amount women earned for every $100 earned by men.
The Bureau of Labor Statistics reports that the average annual expenditures per household in the U.S. in 2015 was $55,978. That means that on average only men with a BA or advanced degree (21.84% of full time employed men), or women with an advanced degree (1.32% of full time employed women) could afford to head a household as a single earner. Most others would have to go into debt, or have one or more other household members work to make up the difference; or some combination of the two. This BLS report is available online at https://www.bls.gov/news.release/cesan.nr0.htm
The Bureau of Labor Statistics also tracks the employment (and unemployment) status of the labor force. Here is its data as of January 2017.
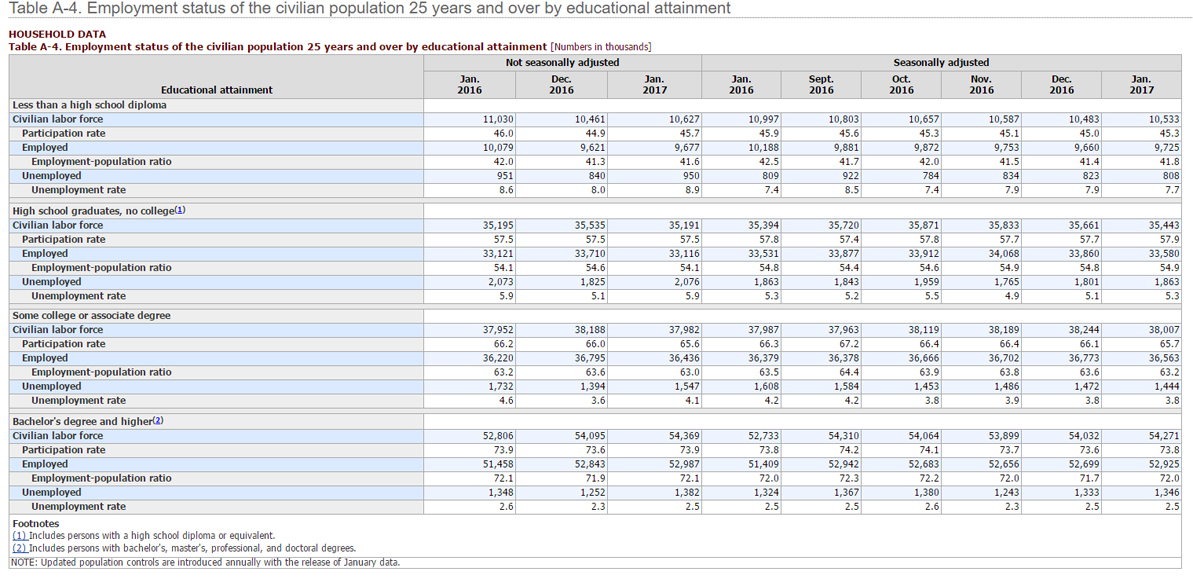
You may find the most current version of this table at http://www.bls.gov/news.release/empsit.t04.htm
For additional information on education and earnings
This BLS chart shows the effects of educational attainment on income and unemployment.
Information Please Almanac's Salary Data
The table on this web page uses the Census Bureau's data to compare men's and women's income from 1990.
Christian Science Monitor story "Growing Cost of Skipping College" (published March 3, 1999)
This article reports on the struggle of those without college educations as they attempt to keep up in a technological economy. It is based in part on the newly published "The Forgotten Half Revisited".
A Marketwatch.com Special Report: Back to School (published April 22-26, 2002)
This series, published in 5 parts, explores the efforts of workers to gain additional education, in part to benefit from the additional pay that comes with it. Here are links to each of the articles. Access to them may require a free registration.
For additional information on "Wage Gaps"
The Wage Gap fact sheet from the National Committee on Pay Equity
The perceived meaning of a high school diploma
Public Agenda polled teachers, students, parents, employers and college professors asking whether they thought a high school diploma meant the recipient had "at least learned the basics". I found the results fascinating. Sharing them with your students could lead to a very interesting discussion.
On June 21, 2006, Talk of the Nation broadcast a segment on the employability of High School grads (those who got a high school diploma, but pursued no further formal schooling). It should provide enlightening listening for those who believe that a high school diploma on its own is the key to success in the world of work.
If this worked well
Have your students use any more recent statistics to update the tables above. What, if anything, has changed?
Have your students use the more detailed data available to prepare tables similar to those above for specific racial groups (i.e. blacks, hispanics, and non-hispanic whites). You might then divide your class into smaller working groups, assigning each a racial group for which to prepare a set of tables. After all have completed their assignments, you could have each group present its results to the entire class. Once all groups have reported, you could go on to lead a class discussion where you compare and discuss what was found.
return to the Interesting Numbers page
return to the Warm-up activities page
return to the Lesson Ideas page
copyright © 1998-2017
classroomtools.com. All Rights Reserved.
original web posting: Friday, December 11, 1998
last modified:
Saturday, March 11, 2017